The Numerik Index is your quarterly sales performance benchmark report, created to give you a wider perspective on how you stack up against your peers and all Numerik users.
We’ve been working on it for the past few months and are very excited to be giving you the first look: let’s dive in!
How do you stack up? Get your sales performance snapshot with the Numerik Index
Watch Jonathan’s interview to discover what the Numerik Index is, why we made it, and its benefits, or scroll down to read the full summary.
What is it?
The Index is a free report sent out to Numerik users each quarter which shows you a snapshot of your growth for the quarter, your company’s performance, and how you compare to Numerik’s user base as a whole.
“The idea behind it actually came from the way that school reporting works, where students are able to see how their marks compare to other students in their school and in their state.”
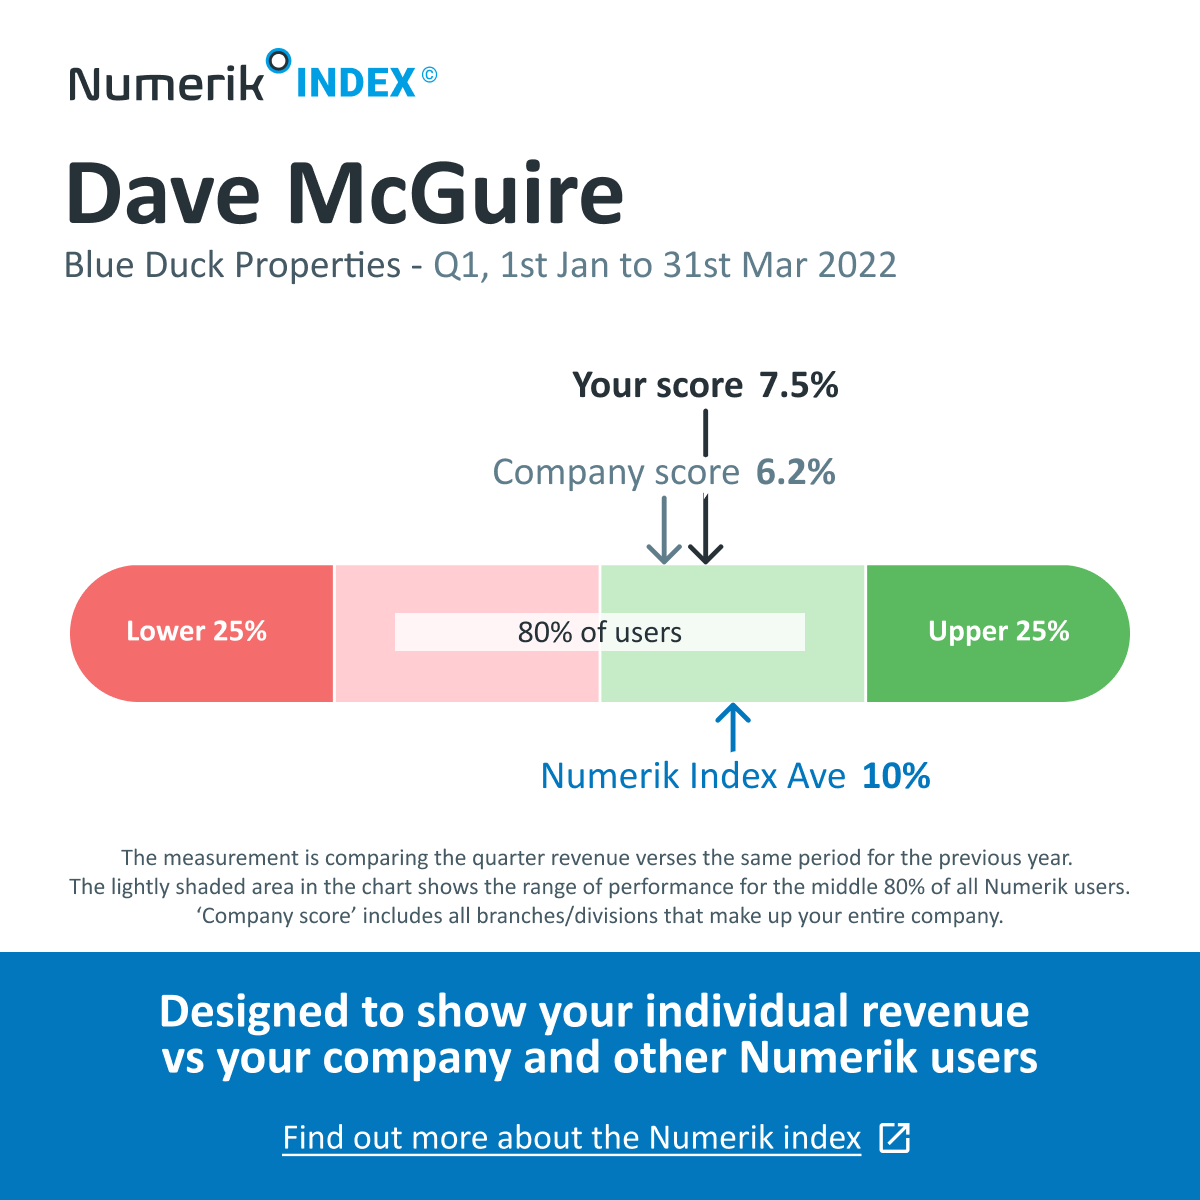
Here’s an example of what your Index may look like:

What each aspect means:
- Your score: The growth in sales you’ve gained from the previous quarter last year, compared to the most recent quarter this year. In our example, Dave grew 7.5%.
- Company score: The growth achieved by the reps in your company over the same time period.
- Numerik Index Ave: The total growth achieved by all Numerik users over the same time period.
- Lower 25%|80% of users|Upper 25%: A general performance outline showing grouping of the lower and upper sales growth levels, and where the majority of Numerik users are placed in the Index.
“It gives you that really good view of where you sit compared to your company and where you sit compared to other Numerik users.”
Why did we create it?
We decided to create the Index to help our customers understand their sales performance from a different perspective:
“At the end of the day, Numerik’s about managing the numbers, helping people succeed and improve their sales performance.”
From our point of view, the Index shows us how our system is making a difference to your performance.
What’s the benefit?
“From a reps perspective, we've found it's very interesting to know how you compare to other reps. Salespeople are competitive by nature, and it’s super interesting to see your performance and sort of compare that to other users.”
In addition to giving competitive insight, the Index acts as a snapshot in time, creating a performance record. As new reports are sent out each quarter, you can begin to build up a performance history, and see your progress on a larger scale.
Where to next?
Keep a close eye on your inbox: your Index will be emailed to your Numerik user email address once per quarter.
Each Index includes one full PDF report and a simple infographic for sharing among your team, or wherever you’d like.
What else can the Index give me?
Not only does the Index show us a snapshot of rep performance, it reveals surprising sales performance trends at regional and industry levels. We’re very excited to dive into the data and explore what these trends say about the sales landscape, coming in our second release.
For our second Index release, Jonathan and Connie will break down the Index’s wider-reaching discoveries, with an extra report and commentary. They’ll explore what the Index’s findings mean for each industry, and discuss regional results to give you more context on how your sales performance stacks up. If you don’t want to miss it, keep an eye on your Inbox this October!


.png)